
Coal-fired generating stations receive and burn millions of tons of coal per year. The cost of this coal is the single largest operating expense of a coal-fired plant. If “coal is just coal” then all the plant coal handlers have to do is send it to the boiler coal bunkers, right?
Wrong. Coal is not just coal. Coal comes in many different variations, some with very high quality and some with lower quality. These variations result in different plant performance aspects and different operating and maintenance costs. With thousands of tons of coal arriving and moving around a typical plant each day, it is extremely important from an economic perspective as well as a plant efficiency perspective to understand the specifics of each ton of coal and how to move it, store it, and blend it to achieve maximum benefits.
A generating station is a business and the primary goals of any business are to maximize profits while maintaining corporate social responsibility and assuring a long-term income stream. Therefore, controlling the cost of a MWH (Megawatt-Hour) is one of the main steps in making the business case for the existence of a generating station. The question really is: How can a coal plant remain viable in a competitive market that is not always on a level playing field?
For most of the history of electrical power generation, coal has been king. From 1950 to 2000, coal-fired electrical generation consistently accounted for approximately 48-53% of total generation each year. See Figure 1.
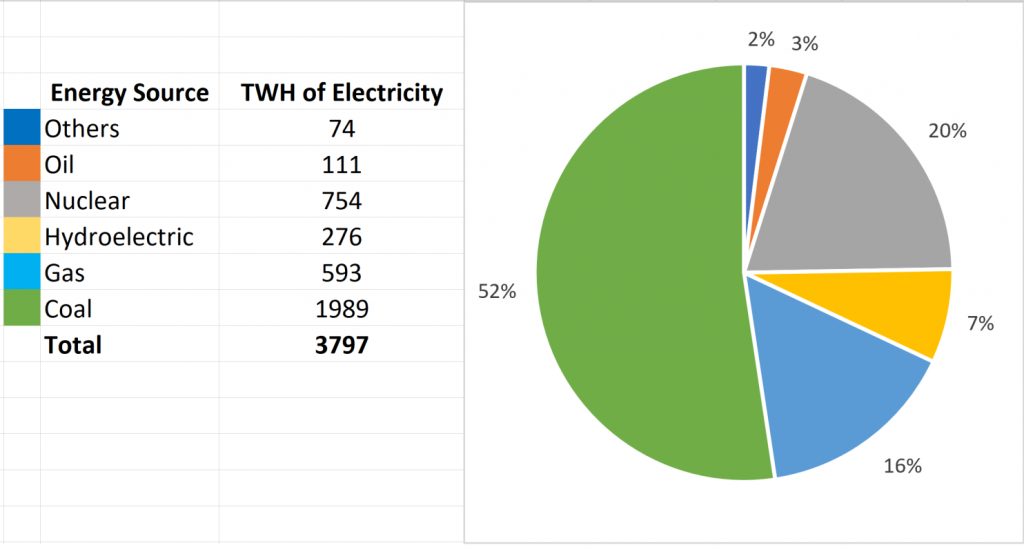
Figure 1 – Electricity Production from All Energy Sources in 2000
Coal use in power generation began to decline in the new millennium following utility deregulation. Coal began being squeezed out of the marketplace by cheaper natural gas and subsidized renewables. As shown in Figure 2, as the use of natural gas and renewables increased, the use of coal decreased. This has caused many older coal-fired plants to close. According to the Sierra Club, 268 coal-fired power plants across the nation have retired or announced specific plans to retire since 2010 — or more than half of the plants operating at the end of the last decade.

Figure 2 – Electricity Production from All Energy Sources in 2014
To answer the question: Why does the cost of a MWH matter? It matters in order to keep coal generation competitive in a marketplace filled with cheaper fuel options in an uneven playing field. To be one of “the last coal plants standing”, plants need to understand the market, and what MWH cost is competitive enough to keep running.</P
Factors that affect the cost to generate electrical power include:
Typical Rankine cycle plant efficiency is only about 35%. The biggest component of cost of operation of a power plant is fuel. A small drop in fuel cost results in major savings, which results in increased competitiveness.</P
When discussing plant efficiency, the term Heat Rate is used. Heat rate is the inverse of efficiency (lower heat rates represent higher efficiencies). Heat rate is defined as:
Since 3,413 BTU = 1 kWH, the heat rate of a 100% efficient plant would be 3,413 BTU/kWH. Heat rate of a real plant is usually between 8,500 – 13,500 BTU/kWH.
For a plant with a heat rate of 9,500 BTU/kWH, only 35.9% of the heat from the fuel burned is converted to electrical power – the rest is lost. Major losses come from:
To calculate the annual fuel cost at a plant, take the product (multiply) of:
9,500 BTU/kWH X 850,000 kW X $2.00/MBTU X 0.8 X 8760 Hours/Year =
Fuel Cost of $113,179,000/Year
In this example. an improvement of 100 BTU/kWH, to 9,400 BTU/kWH (approximately a 1% improvement in plant efficiency), will result in savings of $1,191,160/Year!
Electricity is bought, sold and traded in wholesale and retail markets (Figure 3), which operate similarly to wholesale and retail markets for other products. The purchase and sale of electricity to resellers (entities that purchase goods or services with the intention to resell them to someone else) is done in the wholesale market, while the purchase and sale of electricity to consumers is done in the retail market.
Figure 3 – Electrical Energy Wholesale and Retail Markets
Independent System Operators (ISOs) and Regional Transmission Organizations RTOs) have responsibility for ensuring reliability and adequacy of the power grid. Since ISOs and RTOs do not own any physical assets, they must sign contracts with generation suppliers to provide needed services. The markets are used to procure generation supplies needed to maintain reliability. Once generation supplies are procured, the generation can be dispatched as needed to meet demand.
One of the market types used is the Energy market. Energy markets are forward-looking markets that ensure that enough generation capacity is online and able to produce energy on a day-ahead (24-hours ahead) to one-hour-ahead basis.
Virtually all energy markets are operated as “uniform price auctions.” Under the uniform price auction, generators submit supply offers, and the ISO/RTO chooses the lowest cost supply offers until supply is equal to the demand. Renewables, nuclear and newer combined-cycle generating units are usually the cheapest. This process is called “clearing the market.” The last generator dispatched is called the “marginal unit” and sets the market price. Any generator whose supply offer is below the market-clearing price is said to have “cleared the market,” and is paid the market-clearing price for the amount of supply that cleared the market. Generators with marginal operating costs below the market-clearing price will earn profits.
As an example of how this system works, assume there are five suppliers, each of which offers its capacity to the market at a different price. These supply offers are shown in Table 1.
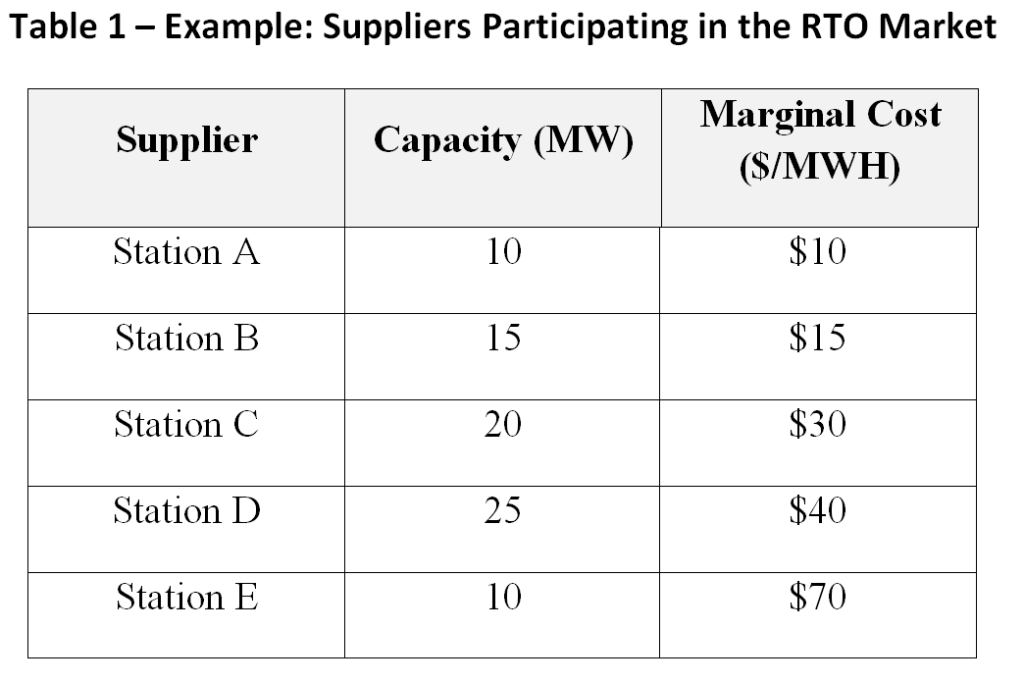
The ISO/RTO aggregates these supply offers to form a single market-wide “dispatch stack” or supply curve (Figure 4). Demand is represented by a vertical line. In this case, demand is 55 MWH. Stations A, B, C and D clear the market. Generator E does not clear the market since its supply offer is too high. The market-clearing price, known as the “System Marginal Price (SMP)” would be $40 per MWH (the price of the last generator to clear). Generators A, B, C, and D would each be paid $40 per MWh. Generators A, B and C would earn a profit. Generator D is the marginal unit, so it earns zero profit.
Figure 4 – Example: The Uniform Price Auction
If a coal-fired generating station is to remain viable in the future, it needs to understand the System Marginal Price for the market in which it operates and target a marginal cost that is competitive in this market. The main cost that can be controlled is the largest cost: fuel.
This is where effective coal blending comes in. It allows the plant to achieve full load by blending expensive coal with cheaper “value” coal to provide the BTUs required at an overall cost that is more competitive in the market.
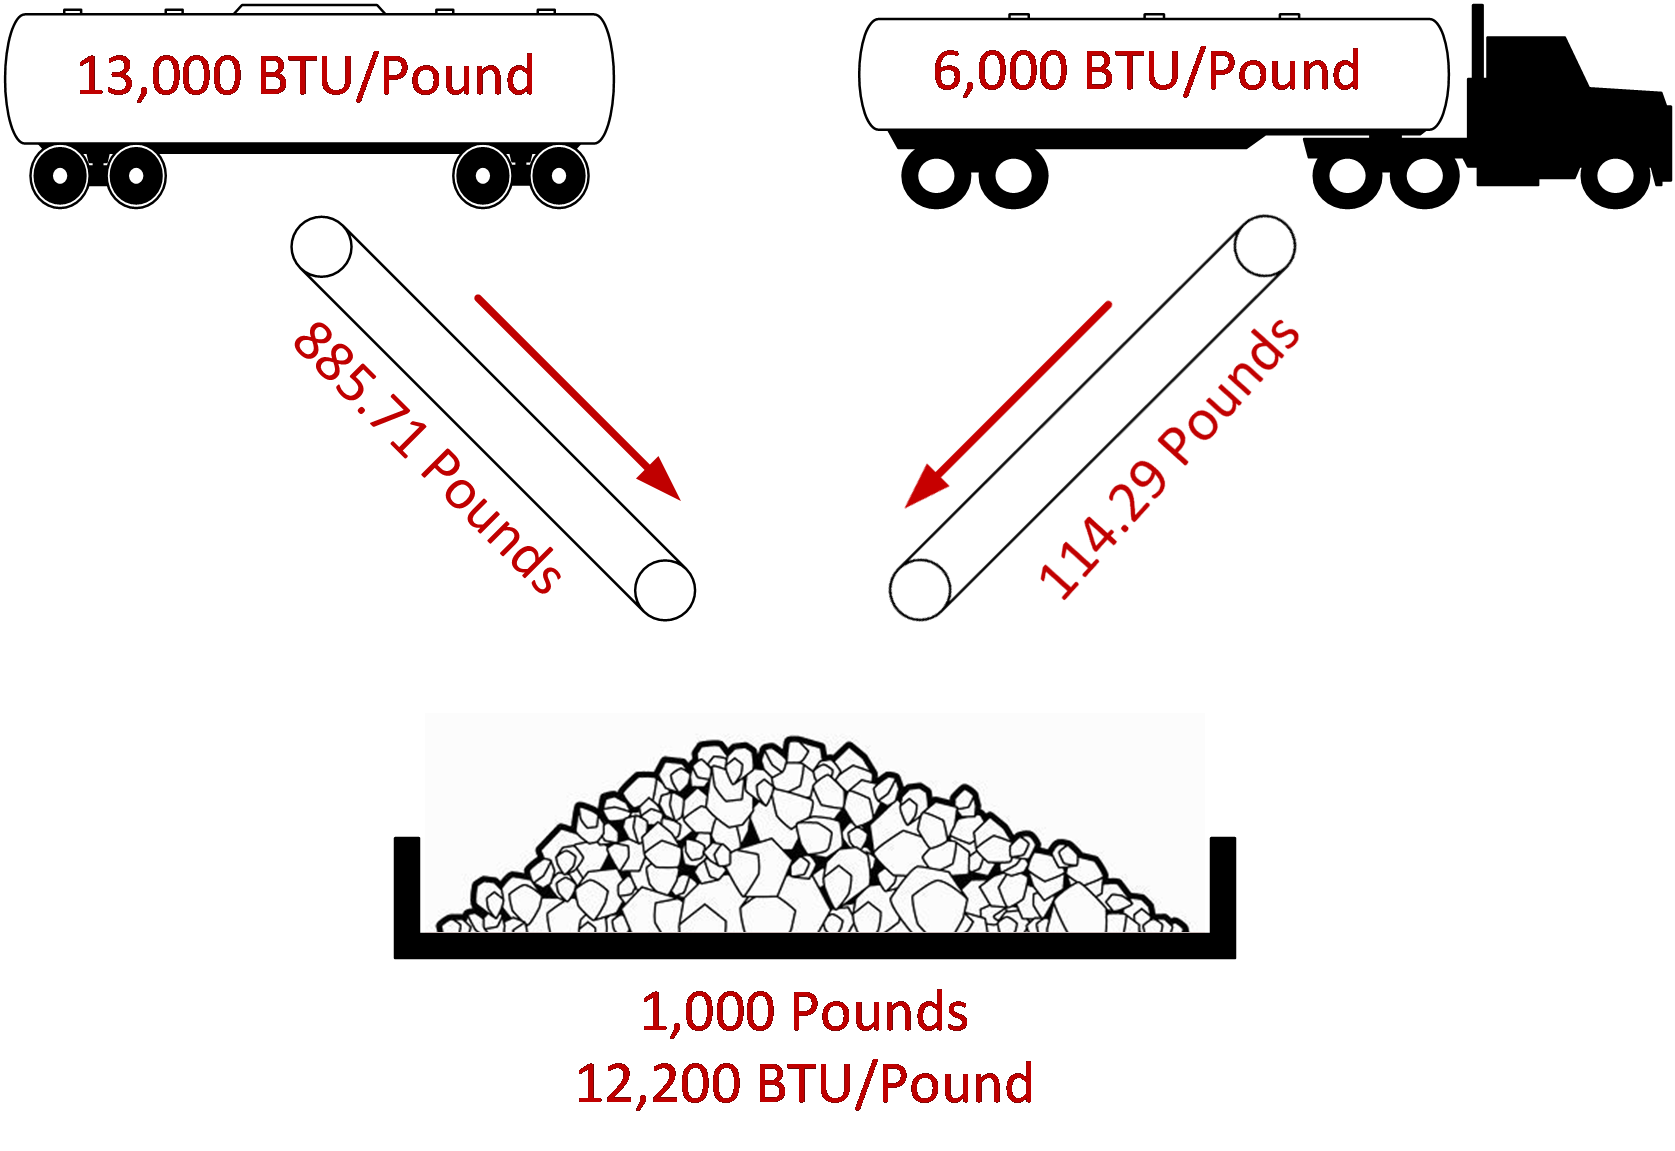
As a simple example, refer to Figure 5. Assume 1,000 pounds of 12,200 BTU/lb coal is required. The available sources are expensive 13,000 BTU/lb coal delivered by train and cheap 6,000 BTU/lb coal delivered by truck. To achieve a 1,000-pound blend of 12,200 BTU/lb coal, 885.71 pounds of train coal and 114.29 pounds of truck coal is blended.

Figure 5 – Simple Coal Blending Example
This is a very simple example, but it demonstrates the concept of achieving the desired overall BTU/lb of coal while keeping the total fuel cost lower. Note that other factors must also be considered during the blending of coal from different sources, such as sulfur, ash and moisture content.