Fidelity: Low vs. High Fidelity GraphicsFidelity: Low vs. High Fidelity GraphicsFidelity: Low vs. High Fidelity GraphicsFidelity: Low vs. High Fidelity Graphics
  • Home
  • Services
    • Services Overview
    • Technical Training
    • Plant Engineering
    • Technology Transfer
    • Short Course Catalog
  • Industries Served
    • Power Generation
    • District Energy
    • Transmission & Distribution
    • Pulp and Paper
    • Water and Wastewater Treatment
    • Beverage
    • Heavy Industry
  • Who We Are
    • Our Team
    • Experience
    • Careers
  • Blog
  • Contact us
✕
Novel Coronavirus
Powering Through the Pandemic
July 27, 2020
Furnace Draft wider shot
The Importance of Operating with Proper Furnace Draft
August 26, 2020
Show all

Fidelity: Low vs. High Fidelity Graphics

Published by Nicolette Villanueva at August 7, 2020
A graphical representation of high versus low fidelity graphics

Graphic software, style, and usage have changed over the past few decades.  It is important that facilities adapt and continually update graphics to enhance learning and provide more efficient training.  Although there is a cost with improving training graphics, that cost is often offset with faster training/qualification of new people, shortened training sessions, and fewer unplanned shutdowns as operators will better understand their equipment.


Low Fidelity vs. High Fidelity

When it comes to graphics, they all have some level of fidelity.

A graphic of a power plant

Low Fidelity

A photo of a power plant

High Fidelity

As you can see in the photos above, low fidelity graphics have much less detail than high fidelity graphics. Both types of graphics have attributes that make them suitable for supplementing training materials.

Low Fidelity

Low fidelity graphics are often used when something more complicated is explained. See the graphics below to see how flow diagrams and simple drawings showcase complex concepts.

Examples:

Experiencing the sense of heat

Cooling Water Cycle


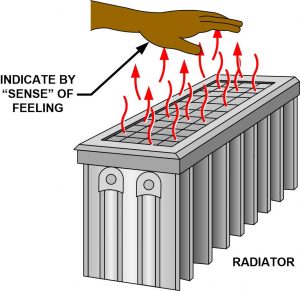
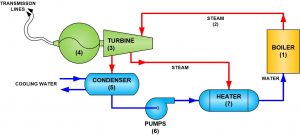
By taking away extra, unnecessary details like backgrounds, extra piping, and more, the learner can easily focus on the elements that are being explained in a particular part of the training.

Lack of detail doesn’t need to mean a lack of color. Low Fidelity graphics can use colors to their advantage. As you can see in the flow diagram and simple drawing above, red is used to indicate heat without actually using the word, although “steam” is a good indicator of heat. In the flow diagram, system components are color-coordinated to showcase different steps throughout the system.


High Fidelity

High Fidelity graphics are great for straightforward explanations.

Example:

A photo of a boiler

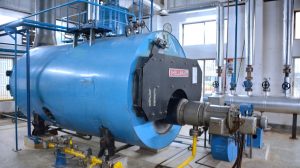
Above is a photo of a Shellmax boiler. Photos are high fidelity because no amount of detail has been removed.

A photo of a boiler with labels

Furthermore, using low fidelity elements such as simple arrows to represent things like steam flow, helps to foster a better understanding of the system and components.


FCS Graphics

Flow diagrams, simple drawings, and callouts just scratch the surface of graphics that FCS offers. It offers a range of fidelity graphics based on the complexity of the component or system and the learner’s needs.

FCS takes care to gather photos of the plant they are training for and provide callouts that show what the learner will actually encounter.

To learn more about the graphics and expertise FCS has to offer, contact us to talk about your plant’s training needs!

Nicolette Villanueva
Nicolette Villanueva is the Graphic/Admin Specialist at FCS. She provides graphics for training and manages the company website. Nicolette has 10+ years of graphics experience and has been working at FCS since April 2019.

Related posts

December 13, 2022

Bridging the Skills Gap: Fixing the staffing problem in power generation.


Read more

power plant worker energy industrial factory inspector expertise

July 25, 2022

The Argument for a Qualification Standard for your Power Plant


Read more
June 13, 2022

Understanding Valve Symbols in FDs and P&IDs


Read more

Leave a Reply Cancel reply

Your email address will not be published. Required fields are marked *

Recent Blog Posts

  • 0
    Liquid Glass: The characteristics of Laminar Flow
    January 20, 2023
  • 0
    Hybrid Power Plants
    January 5, 2023
  • 0
    Bridging the Skills Gap: Fixing the staffing problem in power generation.
    December 13, 2022

Fossil Consulting Services, Inc.

6325 Woodside Court, Suite 222
Columbia, Maryland 21046
Telephone: (410) 312-6240
Email: FCS@FossilConsulting.com

NEW FCS Logo_White
© 2022 Fossil Consulting Services, Inc. All Rights Reserved.